
Short Interest vs. Short Volume: Why 60% Doesn't Mean a Short Squeeze
A big short-volume number can look like a crowded bearish bet. It may be measuring a completely different thing. Separate the position snapshot from the trading activity before drawing a conclusion.
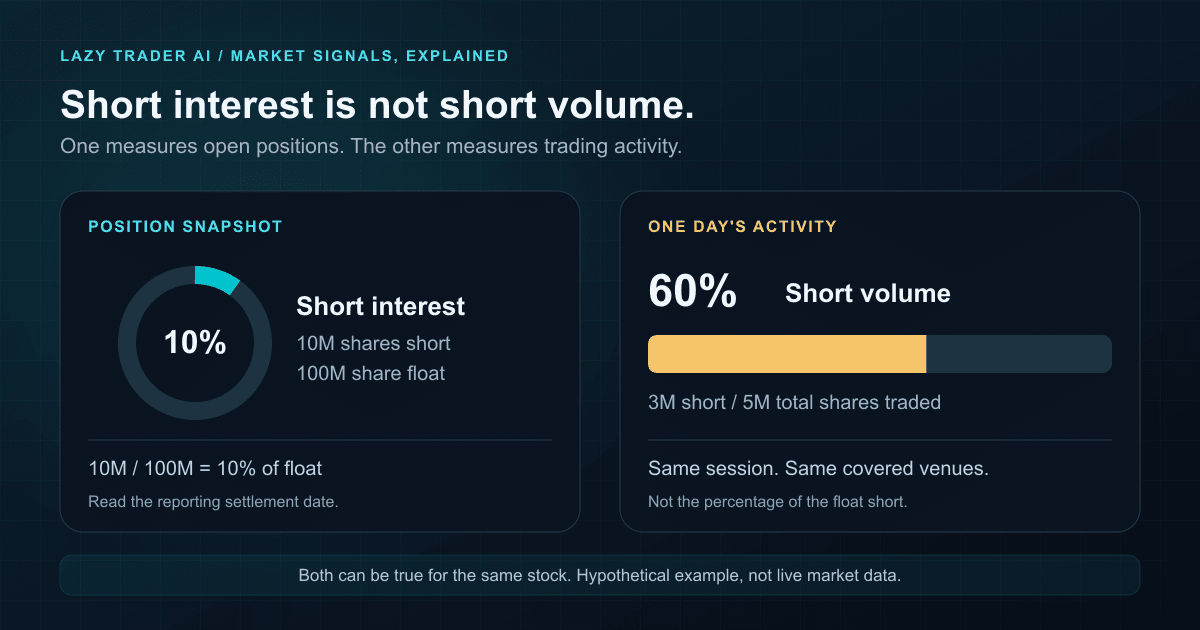
Short interest measures open short positions at a reporting snapshot. Short volume measures shares traded short during a period. A 60% short-volume ratio does not mean 60% of the company's float is short, and it is not a 60% probability of a squeeze.
Before reading a bearish or bullish story into a percentage, ask three questions: what is being counted, what is it divided by, and when was it measured? The headline number is only useful once those answers are clear.
| Metric | What it measures | Denominator / clock |
|---|---|---|
| Short interest % of float | Open short shares at a snapshot | Float; reporting settlement date |
| Short-volume ratio | Short-sale shares traded in a period | Total volume for the same venues and period |
| Days to cover | Open short shares relative to typical turnover | Average daily trading volume; specify the lookback |
What is short interest? What is short volume?
Short interest is a position measure. It captures open short positions on a designated settlement date. FINRA's reporting framework collects these positions twice monthly; the publication comes after the snapshot. It is not a live running count. See FINRA's short-interest reporting schedule.
Short volume is an activity measure. It counts shares in short-sale transactions within the dataset's trading window. FINRA explicitly distinguishes that activity from outstanding positions in its short-interest explainer. A chart refreshed today can still contain an older position snapshot.
How can short volume be 60% but short interest only 10%?
Consider a fictional stock, EXAMPLE. All numbers below are hypothetical, not observations about a real company.
- Open short shares at the reporting snapshot: 10 million.
- Float used for that comparison: 100 million shares.
- Short-sale volume on a later trading day: 3 million shares.
- Total volume in the same covered trading dataset that day: 5 million shares.
Neither calculation contradicts the other. The 60% describes that day's covered transactions, not the stock's outstanding short position. You cannot add daily short-volume percentages to build a short-interest balance: they do not tell you how much exposure was subsequently closed.
A short sale can open and close on the same day
Imagine a trader sells 1,000 shares short in the morning and buys 1,000 back later that session. The short sale can contribute 1,000 shares to the daily activity file, while this round trip leaves no open position for a later reporting snapshot. FINRA describes this distinction in its position-versus-volume guidance.
- MorningSell 1,000 shortA short position opens.
- AfternoonBuy 1,000 backThe same position closes.
- Daily activity1,000 short sharesThe sale still counts as activity.
- Later snapshot0 shares openFrom this round trip only.
The denominator matters as much as the percentage
A ratio is only comparable when its numerator and denominator cover the same market scope. FINRA's daily files are not, by themselves, a consolidated total of exchange and off-exchange activity. Its short-sale volume notice also explains how customer-order facilitation and unshown offsetting purchases can affect interpretation.
For a made-up second example, suppose one non-overlapping venue group reports 600 short shares out of 1,000 total, while another reports 200 out of 1,000. The combined ratio is 800 ÷ 2,000 = 40%, not the first group's 60%. Do not combine a consolidated file with its own underlying venue files; that would count trades twice.
Similarly, check whether a service labels short interest against float or shares outstanding. A different denominator can produce a different percentage even when the short-share count is identical.
What is the short interest ratio, or days to cover?
Days to cover divides open short shares by average daily share volume. It describes the size of the short position relative to typical turnover, not a deadline by which traders must close. FINRA defines the field in its equity short-interest glossary.
10 million short shares ÷ 2.5 million average daily shares traded = 4 days to cover.
That is not a four-day countdown or a promise that every short seller will buy. The average-volume lookback matters: a short burst in turnover can change the ratio without proving that open short positions changed. Check the actual short-share count alongside the ratio.
A better checklist before calling a short squeeze
Use short data to frame a question, not answer it in advance. Our research checklist is:
- Read the metric name. Short interest, short volume and days to cover are separate fields.
- Read its date and coverage. A current quote beside an older short-interest report is not a same-time comparison.
- Compare like with like. Keep float definitions, volume windows and venue coverage consistent across observations.
- Keep missing borrow data missing. An absent borrow fee or shares-available field is not a zero fee or zero supply. A lender's availability is not necessarily the whole market.
- Look for independent context. Price action, earnings dates and options execution pressure can add context, but they do not turn a short-volume percentage into a probability.
In Lazy Trader AI, start with ticker research and compare each available module's source date. If a field is warming, unavailable or delayed, keep that limitation in your conclusion. Read our data-source methodology before comparing feeds.
Common questions
Is high short volume bullish or bearish?
It is not a reliable standalone directional call. It records activity, not all participants' intentions or the positions remaining open. A better description is “high short-sale activity in this covered dataset,” followed by the date and scope.
Does 60% short volume mean 60% of the float is short?
No. The daily ratio divides short-sale volume by covered trading volume. Short interest as a percentage of float uses open short shares divided by float. The two percentages answer different questions.
Can I calculate short interest by adding daily short volume?
No. Daily short-volume files are not a ledger of all position openings and closings. Adding the sales cannot reconstruct the remaining position.
Is a high days-to-cover number a guaranteed squeeze?
No. It is a position-to-turnover ratio, not a forecast or a required covering date. No single threshold in this article is a buy or sell rule.
Sources and methodology
Definitions checked on October 21, 2026. Calculations and graphics are original, hypothetical teaching examples; no current ticker statistics or backtested returns are claimed.
- FINRA: Short Interest — What It Is, What It Is Not.
- FINRA: Understanding Short Sale Volume Data.
- FINRA: Equity Short Interest reporting and publication schedule.
- FINRA: Equity Short Interest Data Glossary.
For education and research only, not financial or investment advice. Examples are not recommendations. Trading can result in loss of capital. See our risk disclosure.