
IV Rank vs. IV Percentile: Why the Numbers Disagree
One reading measures distance between two extremes. The other counts how often volatility was lower. Knowing which question each answers helps you avoid mistaking a low rank for cheap options.
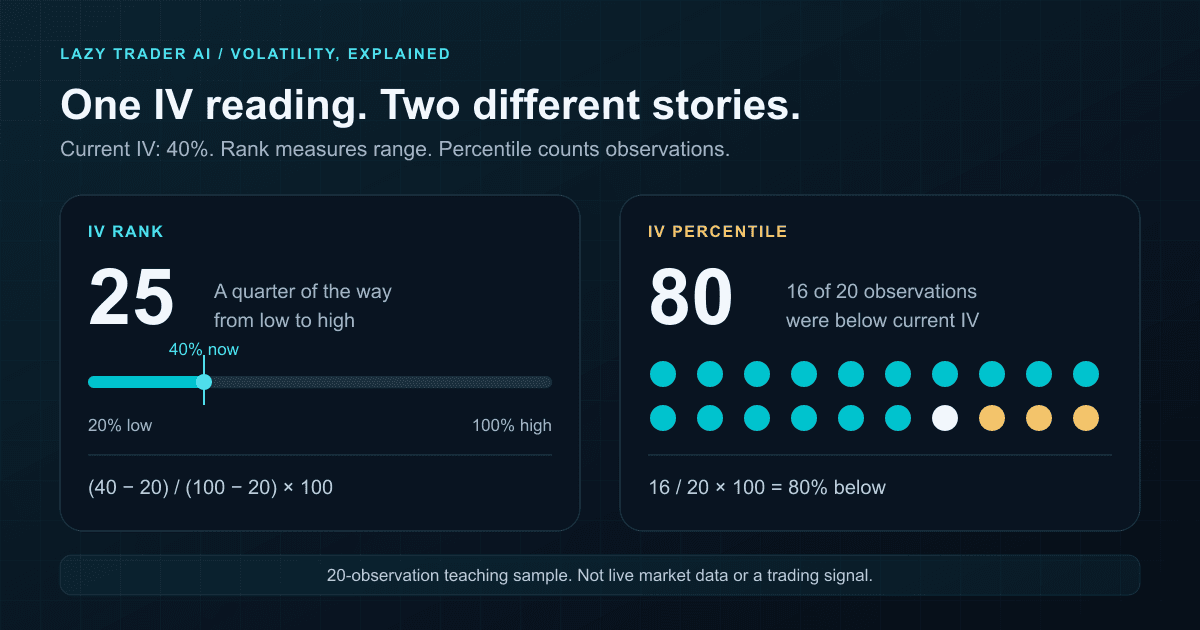
IV rank measures where current implied volatility sits between the lookback's low and high. IV percentile measures the share of observations below current IV. Both compare volatility with its own history, but they can disagree without either being calculated incorrectly.
Picture a stock whose volatility was fairly calm most of the year, apart from one sharp spike. Today's IV can be above most daily readings yet far below that exceptional high. The rank looks low; the percentile looks high. The useful conclusion is about the shape of the history, not an automatic trade.
| Reading | Question it answers | What to inspect |
|---|---|---|
| Current IV | What volatility is implied by option prices? | Expiry, strike or composite method, source time |
| IV rank | Where is IV inside its historical range? | High, low and lookback |
| IV percentile | How often was IV below this reading? | Observation count and treatment of ties |
First, what does implied volatility mean?
Implied volatility is inferred from option prices using a pricing model. It describes expected variability, rather than an up-or-down stock forecast. It is different from realized volatility, which describes movement that already happened. The Options Industry Council explains the link between IV, premiums and vega, an option's sensitivity to IV.
Keep three units separate: 40% IV is an annualized volatility input, IV rank 40 locates that input in a range, and IV percentile 40 counts its position among past observations. None means a 40% chance of profit. A relative reading also does not tell you the dollar cost or risk of a particular option.
IV rank and IV percentile formulas
A common lookback is 52 weeks. IG's definitions set out the range-based rank and the count-based percentile. Expressed on a 0–100 scale:
Interactive Brokers also distinguishes the two fields and offers several lookbacks. Check the calculation behind a platform's label before comparing values. If high equals low, the rank formula has a zero denominator; that is not a meaningful rank of zero. Missing observations should not be silently replaced with zero IV.
Worked example: IV rank 25, IV percentile 80
Use a fictional stock with current IV of 40%. To keep the arithmetic visible, our teaching sample contains only 20 historical observations, not a full year. They are sorted below for illustration, not plotted in time order.
The minimum is 20% and the maximum is 100%. Current IV is only a quarter of the way up that range. But 16 of the 20 observations are below today's reading.
That is a consistent pair of answers: relatively low within the full range, but above most observations. Under our strict “below” convention, the 40% observation is not counted in the numerator. Including equal readings would produce 85 instead of 80 in this tiny sample, which is why the convention matters.
Why a single IV spike can pull rank down
Here is a useful sensitivity check using the same invented data. Replace the sample's 100% observation with 60%, leaving everything else unchanged. The high is now 70%, so IV rank becomes (40 − 20) ÷ (70 − 20) × 100 = 40. IV percentile stays 80: there are still 16 readings below 40%.
The size of that extreme changed the range calculation, not the count below current IV. That does not make one metric universally better. Use rank to inspect range position and percentile to inspect frequency. Read the historical series when the two tell very different stories.
Do not edit genuine spikes out of live research just to obtain a preferred reading. A real earnings shock and a bad data point require different handling. Changes in lookback or methodology should be explicit.
What about earnings and IV crush?
A stock-wide historical reading is not a substitute for the options expiring around an event. Check the actual contract and the term structure—IV across expirations—alongside the earnings date. An event can affect one expiry differently from another.
After earnings, implied volatility can drop sharply. Schwab explains that this IV crush can reduce an option's value even when the stock moves in the buyer's expected direction. Rank or percentile alone cannot tell you whether the premium paid will be recovered.
Read an expected move with its horizon and methodology, not as a directional target or a maximum possible move. For more on separating the event from the trade, see our pre-earnings positioning guide.
A practical checklist for reading IV
- Confirm the series. A single contract's IV and a constant-maturity or stock-level composite need not match. Compare the same series over time.
- Confirm the clock. Read the observation date, not just when the page loaded. Check daily-close versus intraday inputs and the lookback length.
- Inspect the extremes. If rank looks low but percentile looks high, look for a short-lived spike before calling the options cheap.
- Check the calendar and liquidity. Earnings, expiry, bid–ask spread and available volume belong beside the relative-volatility reading.
- Separate direction from pricing. Use options-flow execution context for a different question. A bullish flow interpretation does not make every call attractively priced.
- Keep uncertainty specific. An unavailable percentile is a missing measure, not zero. A high rank does not cap losses for an option seller.
Start from Lazy Trader AI's ticker research, review the volatility fields that are available, and read their source times and coverage. This guide explains the metrics; it does not imply every ticker or preview exposes every field. Our data methodology describes the broader limits.
Common questions
Is IV rank the same as IV percentile?
Not under the definitions used here. Rank uses the high–low range; percentile counts observations below the current value. Check the provider's definition rather than assuming the labels are interchangeable.
What is a good IV rank?
There is no universal trade-entry threshold. Rank describes historical range position, not whether an option is mispriced or a strategy is suitable. A low reading can coexist with above-usual IV, as the example shows.
Does IV percentile 80 mean an 80% chance IV will fall?
No. It describes how often IV was lower in the chosen historical sample. It is not a forward probability or a forecast that volatility must revert.
Can low IV rank and high IV percentile both be correct?
Yes. A large past spike can leave current IV close to the low end of the range while it remains above most ordinary observations. Check the data window, series and tie convention as well.
Sources and methodology
Definitions reviewed on October 25, 2026. The calculations and graphics are original teaching examples, not current ticker data, a backtest or a production pricing model. The 20-observation sample is deliberately shorter than a standard annual lookback.
- Interactive Brokers: IV percentile and rank data-point definitions.
- IG: Implied volatility, IV rank and IV percentile formulas.
- Options Industry Council: Vega and implied volatility.
- Charles Schwab: Options around earnings and IV crush.
For education and research only, not financial or investment advice. Options involve risk and are not suitable for every investor. Buyers can lose the entire premium; some uncovered short-option positions can create unlimited losses. See our risk disclosure.
Related research
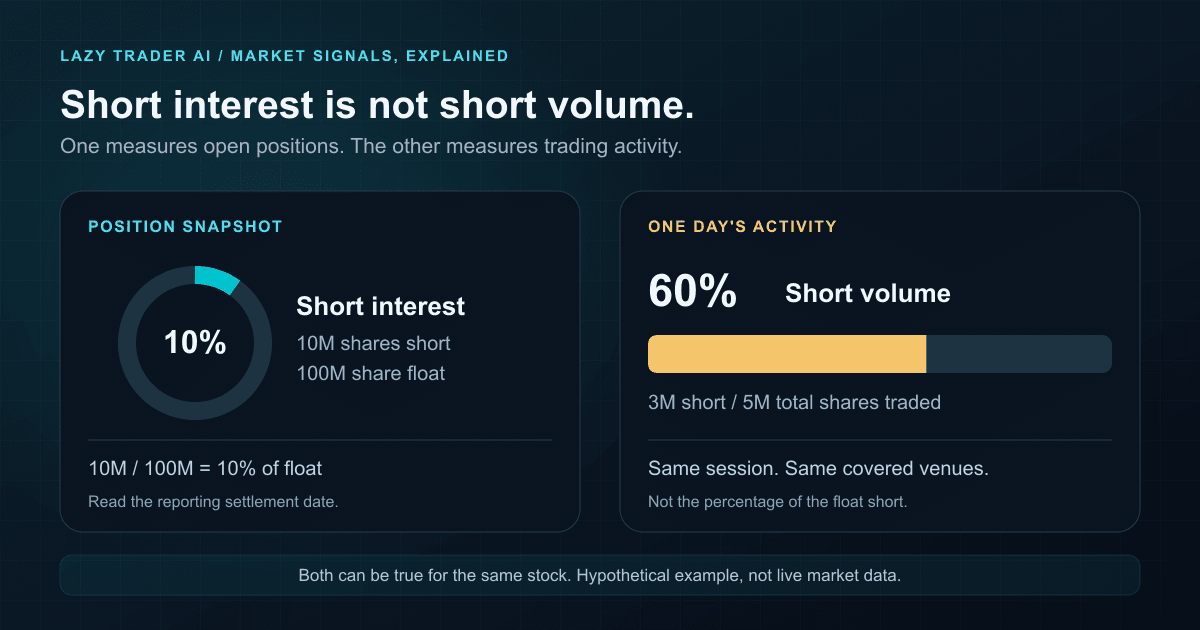
Short Interest vs. Short Volume: Why 60% Doesn't Mean a Short Squeeze
A stock can have 60% short-sale volume and only 10% short interest. Here's the math, the reporting gap, and what to check before calling a squeeze.
Lazy Trader AI Research · Oct 21, 2026 · 7 min readThe congressional stock-trading ban is closer than ever. What it means for traders.
Two bills advanced in 2026 and a bipartisan coalition keeps growing. If a ban passes, does the signal retail traders follow disappear?
Devon Park · Jun 12, 2026 · 8 min readQ1 2026 13F season: hedge funds doubled down on AI infrastructure
The latest filings weren't about new themes. They were about concentration — and almost everyone concentrated into the same AI-infrastructure names.
Mira Chen · Jun 8, 2026 · 7 min read