
Days to Cover: Calculate the Short Interest Ratio
A stock can go from five days to cover to two without a single short position closing. Learn the calculation, test your own numbers, and separate a crowded position from a reason to expect a price move.
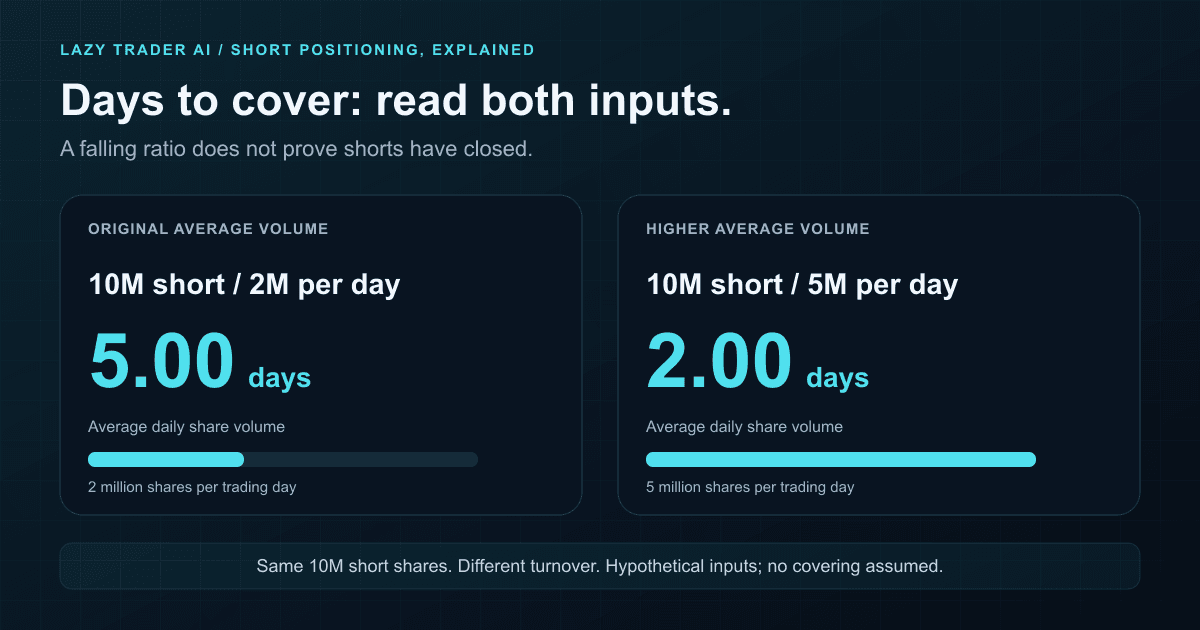
Days to cover, also called the short interest ratio, is reported short shares divided by average daily share volume. If 10 million shares are short and average volume is 2 million shares per trading day, the raw ratio is 5 days. It compares a position with turnover; it does not give short sellers a five-day deadline.
The useful question is: how large is the outstanding short position relative to the stock's usual trading activity? A high reading can make liquidity worth investigating. It cannot tell you whether shorts will buy, whether new sellers will meet them, or which way the stock will move next.
The formula appears in FINRA's short-interest glossary. Keep the units consistent: shares short ÷ shares traded per day = days of average turnover. Do not divide a short-interest percentage by raw share volume.
Free days-to-cover calculator
Enter a reported short-share count and an average daily volume from the same research dataset. Note the volume lookback separately. This calculator divides the two inputs directly; it does not fetch a stock's data or apply a vendor's display floor.
Use share counts, not dollar values or percentages. The starting values are hypothetical.
Raw ratio, rounded for display. This is a turnover comparison, not a deadline or a squeeze forecast.
A result of 0.50 means the reported short position equals half a normal day's trading volume under your inputs. It does not mean a position can actually be closed in half a day. All market participants share the available liquidity, and trading volume can change substantially.
Why days to cover can fall without shorts covering
Consider a fictional company with 10 million reported short shares. First use average daily volume of 2 million shares, then change the volume assumption to 5 million while holding the short position constant.
| Scenario | Shares short | Average daily volume | Days to cover |
|---|---|---|---|
| Original volume | 10,000,000 | 2,000,000 | 5.00 |
| Higher average volume | 10,000,000 | 5,000,000 | 2.00 |
| Lower average volume | 10,000,000 | 1,000,000 | 10.00 |
The ratio drops from five to two in the second scenario, even though the short-share count is unchanged. That is a denominator change, not evidence of short covering. The third scenario shows the reverse: quieter trading doubles the ratio without any additional shares being sold short.
A single busy session only affects an average according to its weight in the selected lookback. Do not replace a 30-session average with today's volume and describe the resulting ratio as the same measure.
What is a high days-to-cover ratio?
There is no universal cutoff that turns a ratio into a buy signal. Five days is a larger position-to-turnover ratio than two, using comparable inputs. Whether either is unusual depends on the stock's own history, its liquidity and the method used to calculate average volume.
For a fictional Stock A, a rise from one to five might be an important change. For Stock B, five might sit below its usual eight. That is why “above five” or “above ten” should be a research filter, if you choose one, rather than a forecast disguised as a rule.
Check both sides of the ratio before describing what changed. An increase in short shares and an increase caused entirely by lower volume are different stories. A brokerage explanation of elevated short interest also notes that heavily shorted stocks may have deteriorating fundamentals or liquidity problems. A crowded bearish position can coexist with a good reason for the bearish view.
A short squeeze requires a price-and-positioning process: buying to close shorts can add demand as prices rise. Days to cover does not establish that this process has started. Look for a dated catalyst and actual market behavior instead of treating a high ratio as a countdown.
Short interest ratio vs. short float vs. short volume
| Metric | Calculation | Useful question |
|---|---|---|
| Days to cover | Short shares ÷ average daily share volume | How big is the position relative to typical turnover? |
| Short interest % of float | Short shares ÷ tradable float × 100 | How much of the float is reported short? |
| Short-volume ratio | Covered short-sale volume ÷ matching total volume × 100 | What share of this dataset's trading was marked short? |
Using the same invented 10 million short shares and a 100 million share float gives 10% short float. With average daily volume of 2 million, that company also has 5 days to cover. Both can be true because the denominators differ.
Daily short volume is not the number of positions still open. FINRA distinguishes trading activity from the position snapshot, including trades opened and closed on the same day. Our short interest vs. short volume guide walks through that difference in detail.
Why two platforms can show different days to cover
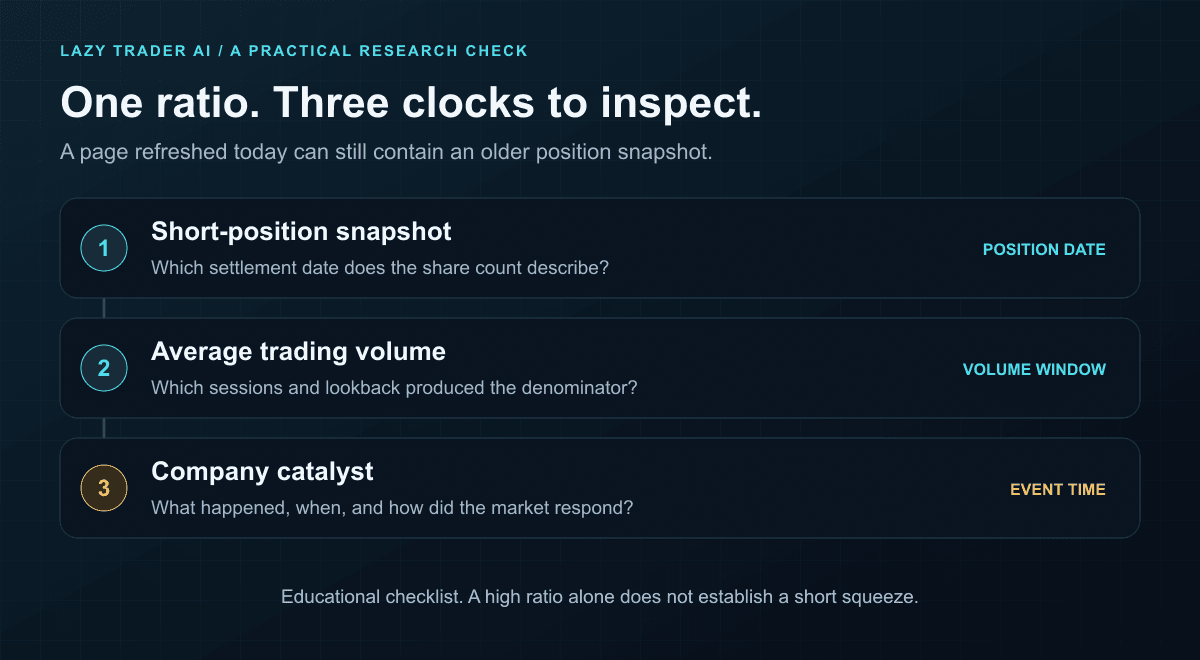
Start with the settlement date of the short-position report and the lookback used for average volume. A new quote does not make an older short-interest snapshot current. FINRA describes reported short interest as a twice-monthly position snapshot in its investor guidance.
Different averaging windows can produce different ratios from the same short-share count. Also inspect display conventions: the Nasdaq Short Interest Report specification documents a 1.00 display for ratios at or below one. Our calculator shows the raw ratio, so 0.50 is a valid calculator result even when a particular report would display 1.00.
Other checks include share adjustments after corporate actions, whether units are shares or thousands of shares, and rounding. If average volume is missing or zero, the ratio is unavailable. An absent figure should not be treated as evidence of zero short interest.
Turn the ratio into a better stock-research question
- Record the dates and inputs. Keep the settlement date, short-share count, average-volume window and ratio together.
- Explain the change. Compare short shares and average volume separately with the previous comparable observation.
- Look for a catalyst. Earnings, guidance or another dated company event can change the thesis. Review the evidence rather than assuming shorts are trapped.
- Inspect actual trading. Price and volume, liquidity, and options-flow execution context can corroborate a research question. Call activity alone is not proof of bullish buying.
- Keep related measures distinct. Borrow fees, lender availability, short float and gamma exposure describe different parts of the market. One cannot fill in for a missing field in another.
Build a research view around a ticker, then compare available short-positioning data with its price chart, options activity and company events in Lazy Trader AI. Read each module's own source date; coverage and access vary.
Create your research workspace →
Prefer to look around first? Browse public ticker research. Free previews are available; some advanced data requires Premium. See our data methodology for coverage and freshness limits.
Common questions
Is days to cover the same as the short interest ratio?
Yes, in this guide both mean short shares divided by average daily share volume. Neither is the same as short interest expressed as a percentage of float. Always read the field definition on the platform you are using.
Does five days to cover mean shorts must close in five days?
No. It expresses the reported short position in units of average daily trading volume. It does not establish a broker deadline, a mandatory holding period or an actual execution timetable.
Is high days to cover bullish or bearish?
It describes short positioning relative to turnover. It can make potential covering pressure worth examining, while the short position itself may reflect bearish views or hedging. The ratio alone does not resolve the direction.
Can days to cover go down while short interest goes up?
Yes. In another hypothetical example, short shares rise from 10 million to 12 million, while average volume rises from 2 million to 4 million. The ratio falls from 5 to 3 even though reported short interest increased.
How do I find a stock's current days to cover?
Use a short-interest dataset that identifies its settlement date and average-volume methodology. A recently refreshed page may still contain an earlier position snapshot. Check the underlying report before calling a value current, and do not substitute the daily short-volume percentage.
Sources and methodology
Definitions reviewed November 4, 2026. The examples, graphics and calculator are original educational material. Every numerical company example is hypothetical; no live stock statistic, expected return or squeeze probability is claimed. The calculator uses your inputs locally and shows an unclamped arithmetic ratio.
- FINRA: Equity Short Interest Data Glossary — ratio definitions and field conventions.
- FINRA: Short Interest — What It Is, What It Is Not — positions, trading activity and reporting snapshots.
- Nasdaq: Short Interest Report specification — average-volume and display conventions.
- Charles Schwab: The Short Interest Monitor Explained — interpretation and limitations.
For education and research only, not financial or investment advice. Trading involves risk, including loss of capital. Short selling can involve unlimited losses. See our risk disclosure.
Related research
Options Volume vs. Open Interest: What a High Ratio Really Means
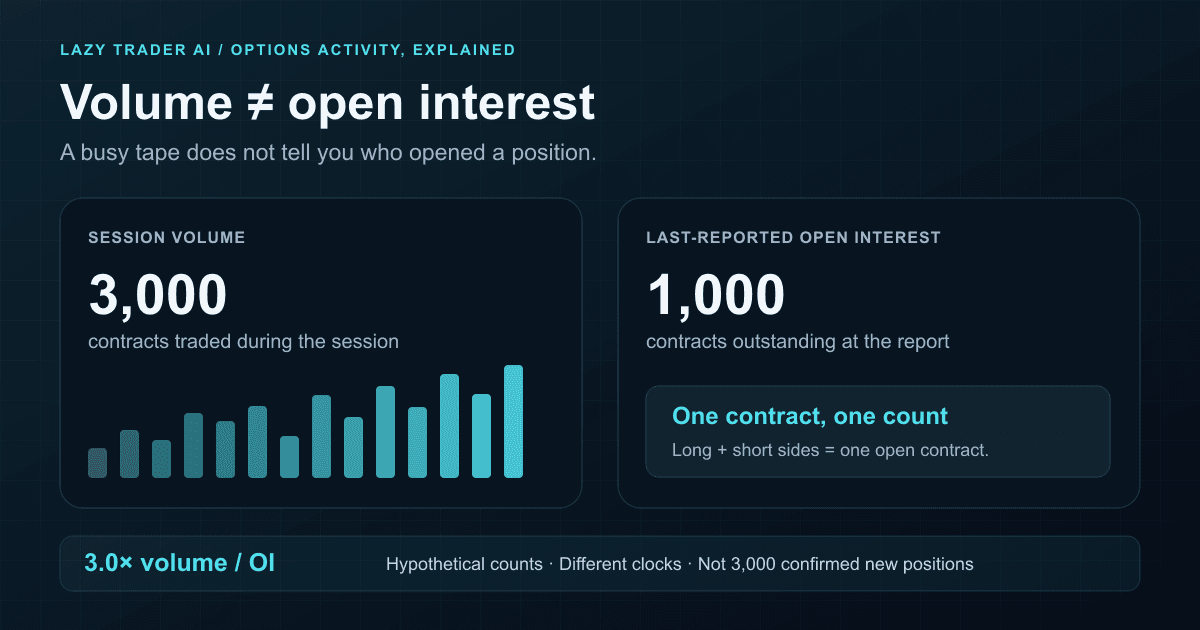
A contract trades three times its open interest. Is that fresh bullish buying? Learn what the numbers establish, what they leave out, and how to research the next step.
Lazy Trader AI Research · Nov 15, 2026 · 7 min read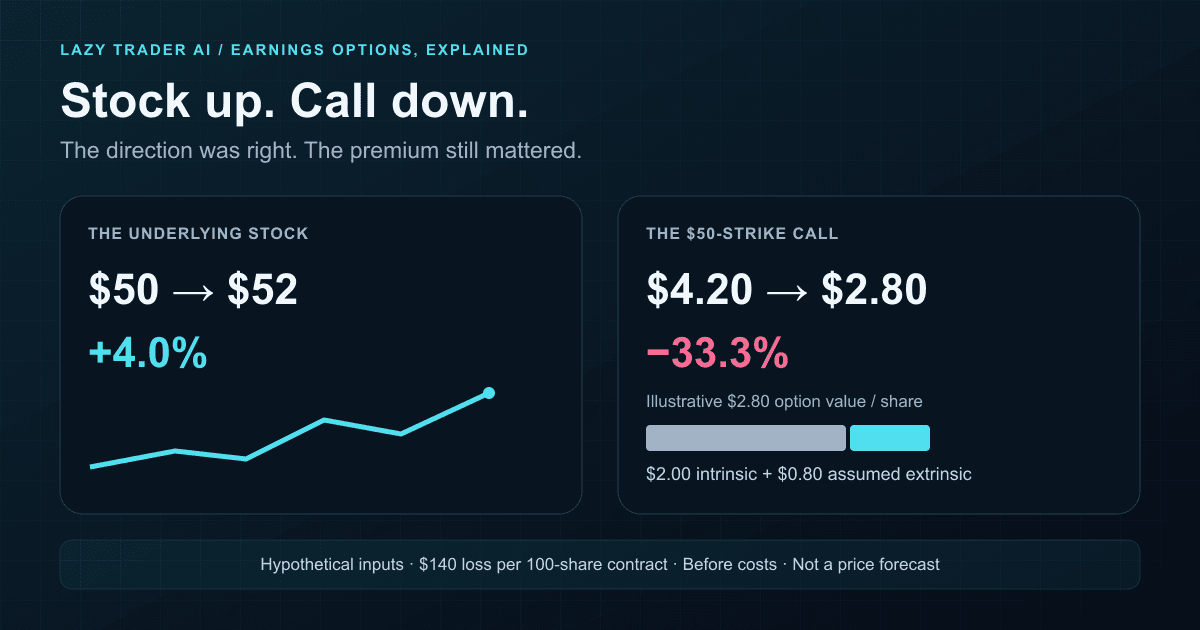
IV Crush Explained: Why Your Call Can Lose After Earnings
The stock went up. Your call went down. Understand IV crush with a worked earnings example, an interactive scenario and a contract-level research checklist.
Lazy Trader AI Research · Nov 9, 2026 · 8 min read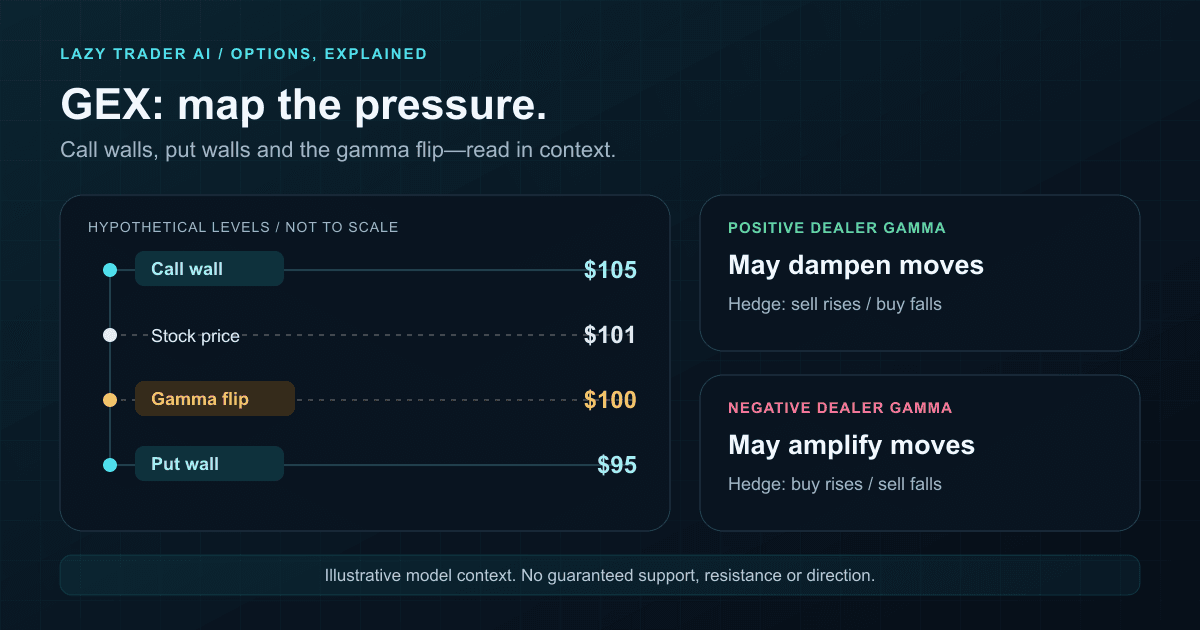
Gamma Exposure Explained: Call Walls, Put Walls and the Gamma Flip
What does GEX actually tell you? Understand dealer hedging, read call and put walls, and combine gamma levels with options flow and the earnings calendar.
Lazy Trader AI Research · Oct 29, 2026 · 8 min read