
Gamma Exposure Explained: Call Walls, Put Walls and the Gamma Flip
A gamma map can help explain how hedging might respond to a price move. The useful question is how the setup could behave—not whether a green number guarantees a rally.
Gamma exposure, or GEX, estimates how an options position's delta changes as the underlying price moves. Market-wide GEX tools aggregate positions or estimates across contracts. A dealer-gamma model then asks how dealers might adjust their hedges.
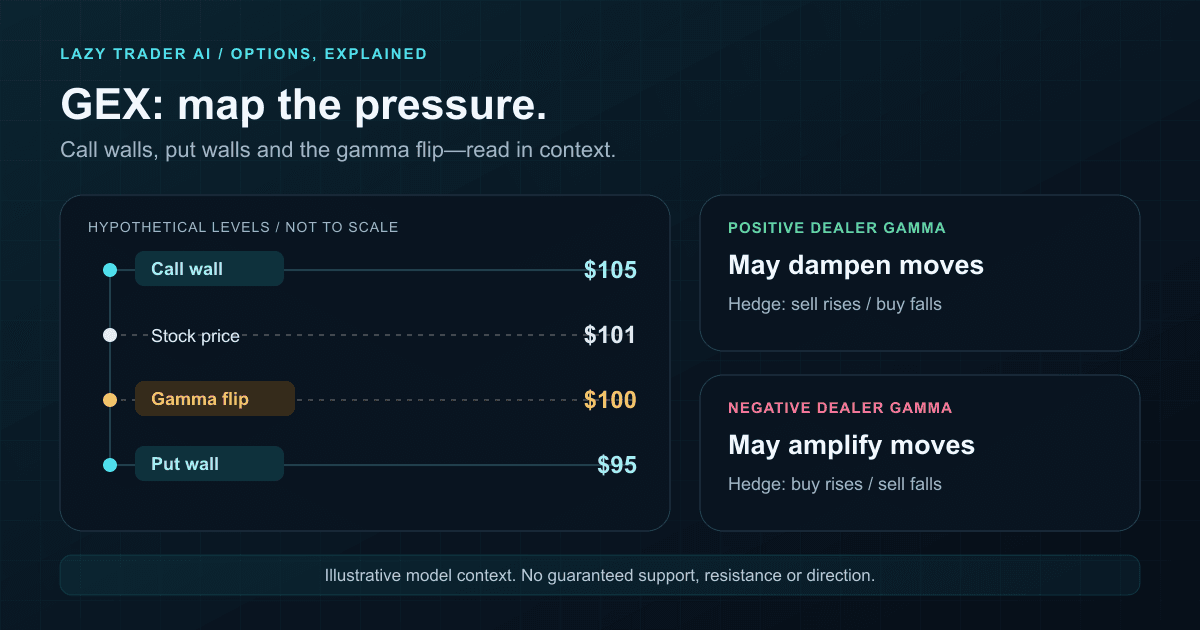
A call wall or put wall marks an options concentration under a provider's method. The gamma flip is a modeled price where net gamma changes sign. These are useful reference levels, but a wall is not a resting stock order and a flip is not an instruction to buy or sell.
Imagine two stocks with equally strong buying pressure. Options positioning could make hedge rebalancing lean against one move and add to the other. That is the question a GEX map helps investigate. It does not establish why a particular candle moved.
Start with delta, then gamma
Delta describes an option's estimated price sensitivity to a small change in the underlying, holding other inputs constant. Gamma describes how that delta changes. The Options Industry Council's gamma explanation distinguishes long options, which have positive gamma, from short options, which have negative gamma.
That distinction applies to both calls and puts. A put is not inherently negative gamma. A long put has positive gamma; a short put has negative gamma. Call-versus-put describes the contract, while long-versus-short describes the position.
Hedging adds another layer. An options dealer may offset a position's delta with stock, futures or other options. If the underlying moves, delta changes and the hedge may need adjusting. Aggregate GEX depends on which positions the model includes and how it assigns their signs. A call-minus-put calculation is a modeling convention, not proof of who owns each side.
Positive vs. negative gamma exposure
When a reading represents dealer gamma, the usual interpretation is about the response to movement. Cboe's research on SPX hedging explains these two mechanisms:
Positive does not mean bullish, and negative does not mean bearish. An amplifying setup can accompany a sharp rally or a sharp decline. Actual impact also depends on hedge size relative to underlying liquidity. In the SPX period Cboe studied, large gross options volume did not necessarily create large net dealer exposure because buying and selling could offset.
Before using the sign, confirm whose exposure the feed describes. Customer gamma and dealer gamma can have opposite signs. A number without that definition is not enough to infer the hedge response.
A worked example: why long-gamma hedging sells a rise
Use a fictional dealer who is long 100 call contracts, each representing 100 shares. Assume an initial delta of 0.40 per share. The option position has approximately 4,000 shares of positive delta: 100 × 100 × 0.40. A simplified delta-neutral hedge shorts that many shares.
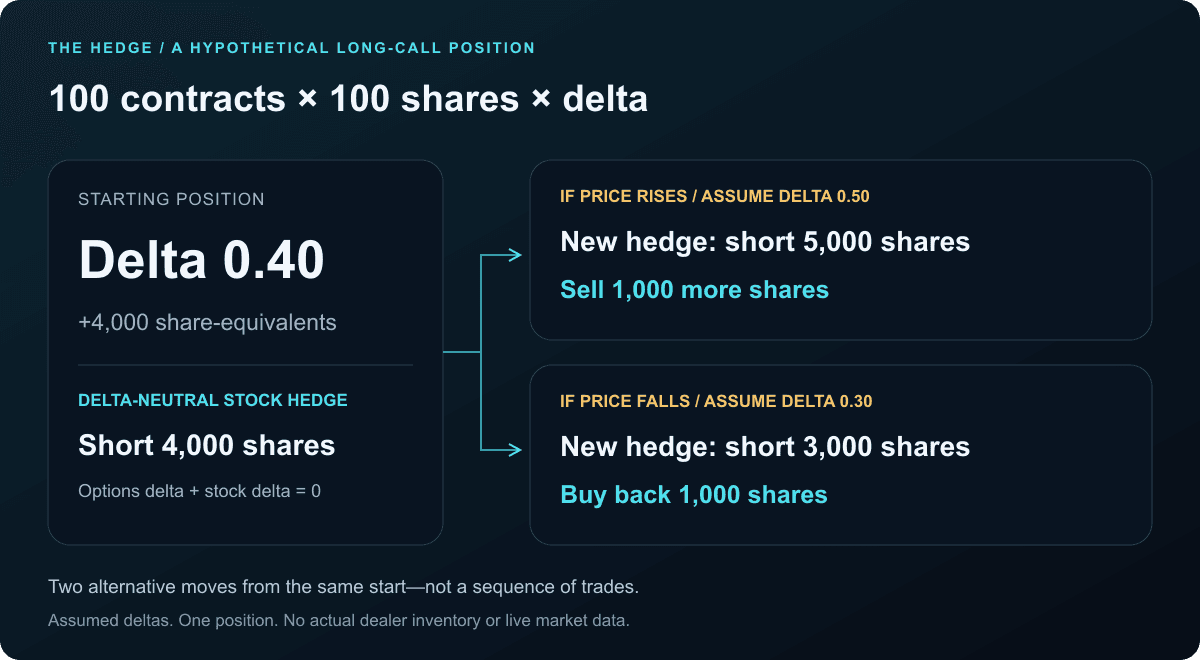
- After a rise: suppose delta becomes 0.50. The option delta is now 5,000 shares. Maintaining neutrality means selling another 1,000 shares.
- After a fall: suppose delta becomes 0.30 instead. The option delta falls to 3,000 shares. The dealer buys back 1,000 shares of the original short hedge.
Reverse the option position to short calls and the hedge adjustments reverse: buying after the assumed rise, selling after the assumed fall. This example isolates one position. A real book can net exposures across strikes, expiries and products, and a dealer need not hedge continuously. Adjusted contracts can also have different deliverables from the 100 shares assumed here.
Call wall, put wall and gamma flip: three different levels
Unusual Whales' GEX heatmap guide describes walls as gamma concentrations and the flip as a change in modeled dealer-gamma sign. Definitions and aggregation can differ between tools, so check the method rather than treating every matching label as identical.
| Level | What it represents | What it does not establish |
|---|---|---|
| Call wall | A prominent call-related concentration identified by the model; often watched above spot. | A guaranteed ceiling or a reason to short every touch. |
| Put wall | A prominent put-related concentration identified by the model; often watched below spot. | A guaranteed floor or proof that buyers will defend it. |
| Gamma flip | A price where estimated net gamma crosses zero when the model reprices the included positions. | A universal breakout threshold or a promise of a trend. |
In our invented map, spot is $101, the call wall is $105, the put wall is $95, and the flip is $100. Those numbers identify places to investigate. They do not imply a path from $101 to $105, nor prove a decline stops at $100 or $95.
Do not assume that being above a flip always means positive gamma. Inspect the provider's sign on each side: the profile can have multiple crossings, or no crossing inside the evaluated range. An unavailable flip is not a flip at zero dollars.
How to read a GEX map alongside options flow
Use the map to make the research question more specific. Instead of “GEX is positive, so the stock goes up,” ask what fresh evidence could push price through a nearby concentration and whether the modeled hedge response would lean against or with that move.
- Start with the right stock and session. Record spot, quote time, GEX observation time and included expirations. An index-options study is not evidence about a particular single-stock book.
- Locate the relevant levels. Check distance from spot, concentration by strike, and whether one expiry dominates. Keep the displayed units with the number; exposure per $1 move and per 1% move are different scales.
- Look for fresh directional evidence separately. Read unusual options flow with execution side, contract details and multi-leg context. Large call premium is not automatically bullish buying.
- Check event and volatility context. Earnings or material news can change the setup. Read the expected move's horizon and IV rank and IV percentile without turning them into direction forecasts.
- Write down what would change the interpretation. New positioning, a different expiry set, a price gap or an outdated snapshot can make the earlier map less useful. Recheck the evidence before describing a wall as holding.
For example: “The stock is approaching the model's call concentration while recent flow shows ask-side call buying. Watch how price trades there and whether positioning changes.” That connects evidence without claiming that either observation caused the next move.
Why GEX readings can disagree or change
Compare like with like: same symbol, observation time, inventory assumptions, units and expiries. A same-day-expiry view and an all-expiry view answer different questions. Long-dated exposure can offset near-term exposure in an aggregate total.
Also distinguish a price or Greek recalculation from a new open-interest observation. Unusual Whales explains that its update cadence varies by view: volume-based and open-interest-based displays do not all update in the same way. A newly rendered chart does not mean every input is newly observed.
Near expiry, relatively small price changes can materially alter an option's delta. But high activity alone still does not establish a large net hedge requirement. Cboe's May 2025 SPX 0DTE analysis again found balanced customer activity important to understanding net market-maker exposure. That finding concerns its specified dataset and period, not every stock or future session.
Start from Lazy Trader AI's ticker research and review the GEX fields, freshness and coverage available for the security. Availability can differ by ticker and access level. Our data methodology explains the broader limits.
Common questions
What does GEX mean in stocks?
GEX means gamma exposure. For a stock, it summarizes gamma across an included set of options positions or modeled positions. Read the sign convention and units before interpreting the aggregate.
Is positive GEX bullish?
Not by itself. Positive dealer gamma describes a potential hedge response that leans against price movement. It does not specify whether the next move is up or down.
Is the call wall always resistance?
No. It is a concentration under a particular methodology. Price can move through it, and the level can change when the underlying inputs or expiry selection change.
Are GEX and unusual options flow the same thing?
No. A GEX map estimates exposure across its included positions. An options-flow feed records transactions. Recent trading can inform a positioning model, but one large print does not reveal the entire outstanding book.
Sources and methodology
Reviewed October 29, 2026. Both illustrations and all position quantities are original hypothetical teaching examples, not live ticker readings, a dealer-position audit or a backtested strategy. The hedging example holds other inputs aside and assumes the stated deltas. Provider-specific labels should be read with that provider's methodology.
- Options Industry Council: Delta and Gamma.
- Cboe: Evaluating the market impact of SPX 0DTE options.
- Cboe: 0DTE positioning, trends and market impact.
- Unusual Whales: GEX heatmap methodology and levels.
- Unusual Whales: Greek and open-interest update timing.
For education and research only, not financial or investment advice. Options involve risk; buyers can lose their entire premium and some uncovered short-option positions can create unlimited losses. See our risk disclosure.
Related research
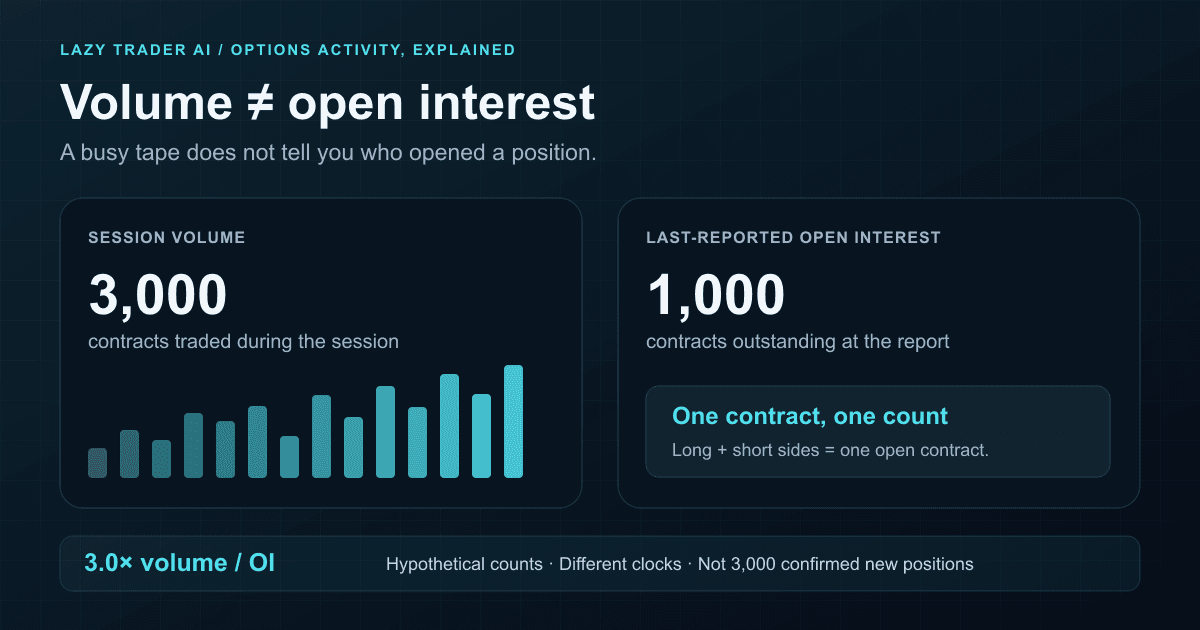
Options Volume vs. Open Interest: What a High Ratio Really Means
A contract trades three times its open interest. Is that fresh bullish buying? Learn what the numbers establish, what they leave out, and how to research the next step.
Lazy Trader AI Research · Nov 15, 2026 · 7 min read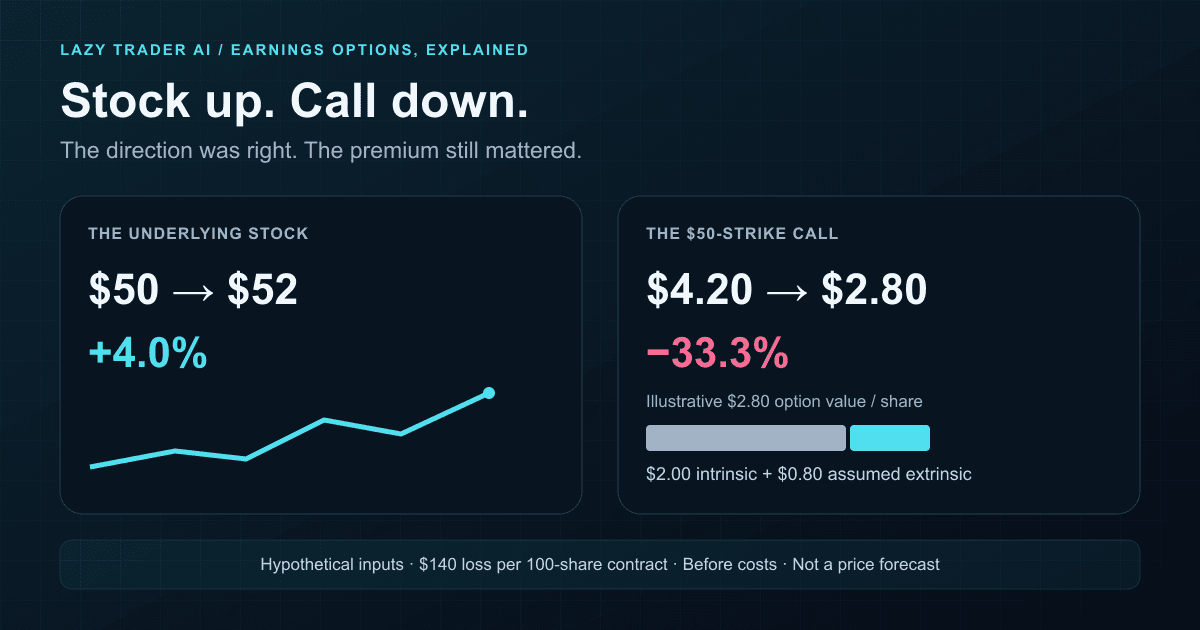
IV Crush Explained: Why Your Call Can Lose After Earnings
The stock went up. Your call went down. Understand IV crush with a worked earnings example, an interactive scenario and a contract-level research checklist.
Lazy Trader AI Research · Nov 9, 2026 · 8 min read
Days to Cover: Calculate the Short Interest Ratio
Use the free days-to-cover calculator, understand what a high short interest ratio means, and learn why a falling ratio does not prove shorts have covered.
Lazy Trader AI Research · Nov 4, 2026 · 8 min read